NPOI 在新版本中增加了對圖表的有限支持(僅 xlsx 文件)
項目地址: https://github.com/tonyqus/npoi
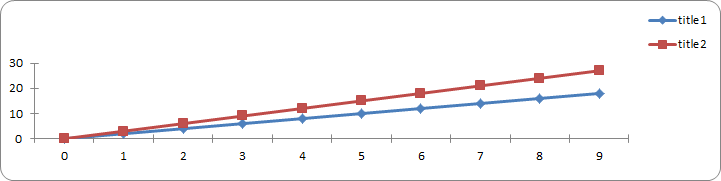
支持折線圖和散點圖
來看demo :
1 2 3 4 5 6 7 8 9 10 11 12 13 14 15 16 17 18 19 20 21 22 23 24 25 26 27 28 29 30 31 32 33 34 35 36 37 38 39 40 41 42 43 44 45 46 47 48 49 50 51 52 53 54 55 56 57 58 59 60 61 62 63 64 65 66 67 68 69 70 71 | const int NUM_OF_ROWS = 3; const int NUM_OF_COLUMNS = 10; static void CreateChart(IDrawing drawing, ISheet sheet, IClientAnchor anchor, string serie1, string serie2) { var chart = drawing.CreateChart(anchor) as XSSFChart; //生成图例 var legend = chart.GetOrCreateLegend(); //图例位置 legend.Position = LegendPosition.TopRight; //图表 var data = chart.ChartDataFactory.CreateLineChartData<double, double>(); //折线图 //var data = chart.ChartDataFactory.CreateScatterChartData<double, double>(); //散点图 // X轴. var bottomAxis = chart.ChartAxisFactory.CreateCategoryAxis(AxisPosition.Bottom); bottomAxis.IsVisible = false; //默认为true 不显示 设置为fase 显示坐标轴(BUG?) //Y轴 IValueAxis leftAxis = chart.ChartAxisFactory.CreateValueAxis(AxisPosition.Left); leftAxis.Crosses = (AxisCrosses.AutoZero); leftAxis.IsVisible = false; //设置显示坐标轴 //数据源 IChartDataSource<double> xs = DataSources.FromNumericCellRange(sheet, new CellRangeAddress(0, 0, 0, NUM_OF_COLUMNS - 1)); IChartDataSource<double> ys1 = DataSources.FromNumericCellRange(sheet, new CellRangeAddress(1, 1, 0, NUM_OF_COLUMNS - 1)); IChartDataSource<double> ys2 = DataSources.FromNumericCellRange(sheet, new CellRangeAddress(2, 2, 0, NUM_OF_COLUMNS - 1)); //数据系列 var s1 = data.AddSeries(xs, ys1); s1.SetTitle(serie1); var s2 = data.AddSeries(xs, ys2); s2.SetTitle(serie2); chart.Plot(data, bottomAxis, leftAxis); } static void Main(string[] args) { IWorkbook wb = new XSSFWorkbook(); ISheet sheet = wb.CreateSheet("linechart"); // Create a row and put some cells in it. Rows are 0 based. IRow row; ICell cell; for (int rowIndex = 0; rowIndex < NUM_OF_ROWS; rowIndex++) { row = sheet.CreateRow((short)rowIndex); for (int colIndex = 0; colIndex < NUM_OF_COLUMNS; colIndex++) { cell = row.CreateCell((short)colIndex); cell.SetCellValue(colIndex * (rowIndex + 1)); } } IDrawing drawing = sheet.CreateDrawingPatriarch(); //锚点 IClientAnchor anchor1 = drawing.CreateAnchor(0, 0, 0, 0, 0, 5, 10, 15); CreateChart(drawing, sheet, anchor1, "title1","title2"); IClientAnchor anchor2 = drawing.CreateAnchor(0, 0, 0, 0, 0, 20, 10, 35); CreateChart(drawing, sheet, anchor2, "s1", "s2"); using (FileStream fs =File.Create("test.xlsx")) { wb.Write(fs); } } |
很多特性都還不支持,這是比較難受的.將就用吧
From: https://www.cnblogs.com/sstn/p/9435337.html